Category Archives: Web Tools

Mastering Front End Performance: Setting Your Performance Budget.

Front End Performance is increasingly gaining awareness amongst developers who code for the responsive web. The problems with it show in virtually every website that goes beyond the simplest complexity. Because of excessive use of external libraries, increased calculations and DOM manipulation in the front end, and on the other side potentially slow devices with crappy internet connections, creating a great (responsive) UX calls for carefully considering the performance impacts of every asset and feature of a website.

You might already have checked out my last post Mastering Front End Performance: The Beginning in which I describe the causes of the problems that drew my attention to the topic and sparked a desire to improve the quality of the web products I build. However, I wasn’t sure where and how to start increasing performance of the code I create, as performance is not a tangible trait or problem that can be fixed like a simple bug.

So the first question to solve was: how can it be turned it into something tangible and therefore testable?


Performance is Relative

To actually make a statement about how good or bad performance is, we have to be able to somehow measure it and compare it. We need a set of defined rules that websites can be run against to be able to judge them with more than our subjective perception. Not the least to have proof for ourselves and our clients that something really is working better (or worse) than before.


Measuring Tools

Luckily, there are tools that make this possible and provide such a set of rules. At least for the optimization of the initial loading and display of a website. A couple of promising ones seem to be these web based ones.

WebPageTest

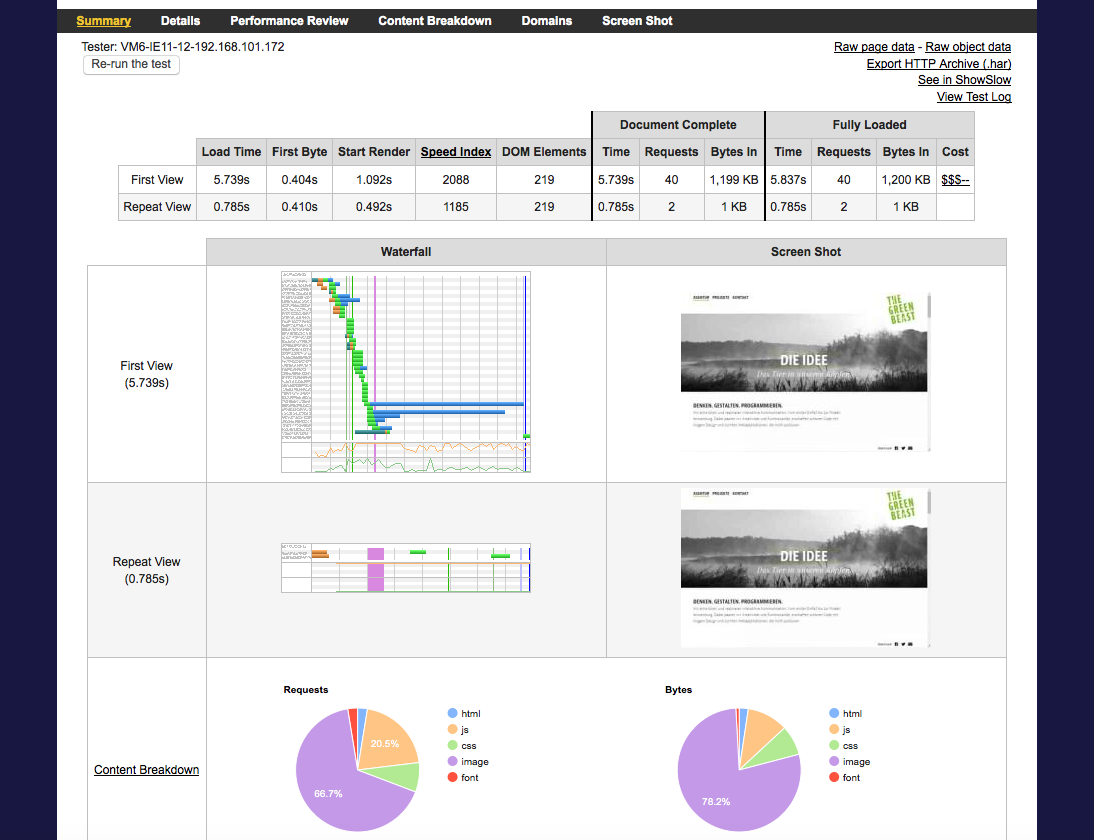
Simply copy and paste the URL of your site into WebPageTest and click “Start Test”. It takes a while, but the results are very detailed and the generated data is visualized in different ways to help you judge different aspects.

You can check out your “Speed Index” score to judge at a glance how you’re doing or dive deep into the type and order of requests. Nicolas Bevacqua gives a great intro on how to analyze the data shown by WebPageTest in his article Let’s talk about Web Performance.

Bildschirmfoto 2015-08-28 um 17.09.10

One great feature he mentions as well is hidden in the “Visual Comparison” Tab you can select on the main site. You don’t necessarily have to insert more than one URL but can use it to see the different stages of your site loading or even create a slow motion video of the order in which the elements in your page load.

Why is this handy? You can use it to increase the perceived performance of your site, which can make a big difference. Making sure your user sees the site build up instead of staring at a blank space for seconds and then everything appears will not increase the time-aspect of performance, but still feel much more responsive.

Also mentioned in Designing for Performance, which is now available online for free, an important advantage of WebPageTest is that you get to pick a browser and location from which to test your site.

“Synthetic performance tools help you get a better sense of how your pages load by using a third party’s testing location and device; you can see how your site performs on various platforms across the world.” – Lara Callender Hogan, Designing for Performance

PageSpeed Insights

As mentioned above, WebPageTest seems rather slow to produce test results. It also gives you a score for “Speed Index” but what is this number good for if you have nothing to compare it to right away? PageSpeed Insights has advantages here. It seems a bit simpler but gives you quick and actionable advice on how you can improve your site’s loading performance. It also gives you a score which can be related to an overall possible score (e.g. you’ve reached 66 out of 100 possible points). It differentiates between “Desktop” and “Mobile” devices which seems a little outdated when working with responsive sites. But the output is interesting either way.

To start a test you just have to enter a URL and click “Analyze”.


Measure and Compare

A one time test might give you an impression of what major issues your website has but the real benefit of measuring performance comes with comparing it. Comparing to similar sites or sites that have a (perceived) better performance. But even more importantly comparing a site to itself – over time. Being able to improve performance by continuously tracking it.

Finding out about WebPageTest and PageSpeed Insights I was a bit disappointed at first. Not because they are not great tools or not showing relevant data but because it would take way too much time to manually check out how my performance score has changed every time I commit a change. It seems like that forces you to plan a special phase in a project for performance improvements. This phase is likely at the end which means there is not much you can do anymore without a great amount of effort.

To really get as much out of performance measuring as possible, it has to be carried out in all programming stages. Detailed improvements can only be achieved if the process of tracking performance is an effortless task that runs on the side.

So the real moment that I got excited about measuring performance was not until I found out about ways of automating it.


Automating Performance Measuring

Both tools that we’ve looked at above can be run in an automated way using the task runner Grunt which you might already include in your development workflow anyways.

grunt-perfbudget

The Grunt plug-in that uses WebPageTest is called grunt-perfbudget. According to the documentation you can use “either a public or private instance of WebPageTest to perform tests on a specified URL”.

Now the performance budgets finally come into play: The plug-in works by letting you set values/budgets for various options like fullyLoaded, requests, and SpeedIndex. If the values your site produces are not within the budget limit, the task fails.

grunt-pagespeed

If grunt-perfbudget feels too slow for you to include in your build process, you should give grunt-pagespeed, which uses PageSpeed Insights, a try.

It is also possible to run PageSpeed Insights via Gulp by installing psi.


Setting Performance Budgets

The optimization of performance is a highly individual task for each website as it greatly depends on the system setup and the actually available options for improvements. In the end, it is up to us to decide when the goal is reached. To do this, it is important to develop a feeling for it.

Start by tracking the performance of the websites you build. Setting budgets – meaning maximum acceptable values for requests and timing – will get easier once you get a feeling for what has great impact on performance and what doesn’t so much.


The State of the Art

This post needs an extended conclusion. Why? I am still not too happy with the currently available tools of measuring loading performance. Both tools I introduced require deployment of a website before it can be tested. Yes, it’s the only way of really realistically measuring performance but it doesn’t exactly make it effortless “on the side” – like I was wishing for further up in the post – if you have to wait for deployment every time you make a commit. I also have legal restrictions concerning this as I am usually not allowed to deploy the code I write to the public until my client decides to launch.

I am still looking for a solution that can be run locally and would somehow be configurable to roughly simulate the production environment. The only plug-in I found that works locally is grunt-phantomas but it’s GUI is too cluttered to give an overview and there is no overall index to keep track of performance at a glance. I could invest the time to set up a private instance of WebPageTest. Or use PageSpeed Insights via a tunnel with gulp and Ngrok which seems to be destined to distort results. But overall, there doesn’t seem to be a solution yet that is easy to set up and enables to track performance at a glance without deployment.

If you have found a great way of incorporating measuring page loading performance into your workflow, please leave me a comment. I’d be glad to know about it.

Still have some question marks hovering above your head? I’m not done with the topic yet either, we’ve barely scratched the surface. There’s more to come, if you’d like to get a note when a new post has been published make sure to sign up below.

[mc4wp_form]

A Front End Dev’s Workflow in 2015 -Tools to create a Professional Project.

The daily routine of front end developers has evolved quite drastically within the past few years. Having an IDE and knowing about HTML, CSS, JavaScript, and browser inconsistencies is not enough anymore if you are setting up or joining a professional project. There is a range of nifty helpers that improve your productivity as well as code quality, and can be considered essential by now.

This article will be of most value to you, if you use a Mac and:

  • want to move beyond the basics and get into a professional workflow,
  • are a front end dev who is trying to catch up after a pause,
  • are a designer looking for more insight into the front end process,
  • or are simply looking for a complete setup of tools to compare to your own.

If you’re here to get a quick overview without all the explanations, skip ahead to the summary at the end.

First things first, I can confidently tell you one sure thing. Nowadays it is unavoidable to get to grips with the command line at least a little bit if you want to work on a professional project. This is due to the above mentioned helper tools we started using to version, scaffold, process, and optimize our code to get it ready for launch as efficiently as possible. The majority of them are executed over the command line.

There are infinite combinations of tools to choose from. With time you will start to refine your set depending on what best fits your and – even more importantly – your projects’ needs. To get you up and going quickly, I am sharing with you the setup of tools I currently most often rely on in my coding routine. They are, so to speak, “the modern front end developer’s basics”.


bash.

Let’s start with the command line itself. “bash” stands for “bourne again shell”. If you type commands into the command-line interface of your choice (e.g. Terminal or iTerm), you’re talking to it. Apart from actually running the web dev tools we’ll talk about in a minute, it is generally useful to know some basic bash commands for any software you might install and use via the command line. Here’s what I most commonly do and when. If you want to, you can open Terminal and type along.

If you’re interested in mastering more commands, I recommend The Command Line Crash Course. It starts from the very beginning and only takes a couple of days.

Navigating through folders.

Alright, so open your Terminal and let’s get started.

  • pwd will tell you where you are in your directory structure.
  • cd .. will move you up out of your current folder into its parent.
  • ls lists documents and folders in the directory you are in.
  • cd plus the name of a directory will move you into it, e.g. cd Shared.

bash-code

  • You can also type cd and drag a folder from your Finder into Terminal to navigate into that folder.
  • Tab completion: If you start typing a directory name and push the tab key, the name will automatically be completed.
  • After you execute commands, you can flip through the command history with the up and down arrow keys (this will save you a lot of typing).

Getting info about your software.

The parameters --version or -v, --help or -h work with most software that is installed over the command line and give you further info about it. For example:

ruby --version

If errors are thrown while trying to get a web project to run, there’s a good chance that you’re not using the right software version of your command line tools with the code base you’re working on.

Searching through files with grep.

This one I don’t use very often, but in the rare occasion it’s a life saver. grep is a small set of commands that let you search for a piece of text in many files and output where findings are discovered. For example:

grep -r "mytext" *

This command will find all occurrences of “mytext” in all files that are in the directory you are currently in and its subdirectories (-r stands for “recursive”).

Grep seems simple but it is powerful. It lets you perform complex searches with the help of regular expressions. That is actually what the name stands for: “Global Regular Expression Print”.

There are many more bash command variants that can be just as useful. All of them are listed in this documentation.


Versioning with Git.

Git is a version control system and in my opinion a most useful tool that should be used for every project you create, no matter how tiny. Generally speaking, it monitors the changes in your project files and saves a history of them. You can retrace all changes and jump back and forth as you like. It also enables you to work collaboratively on the same codebase by tracking who changed which lines of code and keeping a shared codebase that everybody contributes to on a server.

Doing basic operations with Git is not hard. However, the more people work on a project, the more confusing the produced history becomes and the more likely it is that conflicts occur because more than one person tries to change the same line of code. Then you are quickly in need of more advanced Git commands, which can feel like a real science.

Getting into the details of Git would be too much for this article but I do have some links for you. You can find info on how to get started with Git on the official Git page. The reference manual there will also come in handy for sure.

There are some applications that provide a GUI for Git. Hardcore command line people will probably give you a funny look but I personally use SourceTree by Atlassian. I prefer viewing file differences and the commit history in SourceTree but usually execute Git commands simultaneously over the command line.

Start simple, maybe create some test projects on Github to tinker around and see what works best for you.

Beware the binary.

One last piece of advice may also be, that Git can track changes in text files and save only those changes in its history. If you start uploading binaries like image files into it and then change those, it has to save the entire file again. Depending on how frequent you do this, the size of your Git history can become larger than you might like.


Package managers: Homebrew, npm and bower.

Software that is used to build the web ages as rapidly as everything on the web. It is quite common that a project that was started last year does not work with the current versions of its dependencies anymore. If you are working on more than one project at a time, you will run into the need of being able to use different versions of software for different projects.

Actually, wouldn’t it be great if the entire set of needed software including its versions could be defined and gathered at once?

This is where you will start being grateful for package managers. The following ones work at different levels, so they can not replace one another.

Homebrew.

Homebrew is a package manager for OS X, so it is useful for much more than front end development. As they say on their website, it “installs the stuff you need that Apple didn’t”, for example Node.js. A complete list of available packages can be found on Search Brew.

Homebrew will load and install a software and all of its dependencies with the single command

brew install [package]

It saves the software it installs into a specially created directory named Cellar/ and then symlinks into /usr/local.

You can install multiple versions of a software in parallel with Homebrew. By using switch the symlink is updated to whichever version is desired and therefore lets you jump back and forth as needed.

brew switch [package] [version]

More on how to work with Homebrew can be found in the documentation.

npm.

Stands for “node package manager” and has a set of packages that are based on Node.js available. You can install them with all needed dependencies via

npm install [package]

The most popular packages include yo, Grunt, and bower. These make up the Yeoman workflow for web projects, which we will look at in a second. But there are also many other packages that you will want to use in your projects. You can even make your own (and even private ones).

The packages can be installed locally, meaning there is not a single global version on your computer, but each project has its own set in its working directory. To keep track of the packages you are including in your project, there is a file named package.json in which all packages and versions are defined. If somebody new joins a project and is given this file, they can install everything defined in there by executing

npm install

Usually, you would keep package.json in your Git repository while leaving all the actual modules out of it. This keeps your repository slim and up- and downloads to a minimum.

The documentation of npm can be found here.

bower.

bower is explicitly a package manager for the web, installed via npm, and part of the Yeoman workflow, which comes up next. Its packages are JavaScript libraries and frameworks such as jQuery, backbone, and Modernizr. You can search through them here or over the command line with

bower search [package]

Similar to npm, the setup of required packages is defined in a json-formatted file named bower.json which is usually the only part that is kept in a Git repository. Everything stated in there is then loaded into your project through

bower install

This is how bower.json typically looks like.

bower-json

Nice! Here’s a list of all bower commands.


Scaffolding with Yeoman’s yo.

Alright, we are pretty deep into it by now. Conveniently loading JavaScript libs into a project with bower is great. But automatically setting up your project directory structure and basic file templates to get started is even better. This is where Yeoman’s yo comes into play.

With the yo command line tool (which is also installed using npm) and one of the many Yeoman generators that are available, you can scaffold – meaning to build a base structure for – any type of web project. This ranges from simple webapps to Angular, Laravel, or Meteor projects.

If you can’t find a generator that suits your needs you can create your own.

First you globally install the needed generator, for example:

npm install -g generator-webapp

Then – if you’re not already there – you navigate into your project directory and let the scaffolding begin by executing the generator:

yo webapp

And within just a few seconds you have a project set up. Here’s what we just created in an empty folder webapp/.

yo-webapp-result

Can you spot the package.json and bower.json files we talked about earlier? Some defaults will already be set but you can always configure to your needs and update your project.

So far, we talked about two out of the three tools that are part of the Yeoman workflow: yo and bower. Keep on reading to find out what the third, namely grunt is all about. It’s definitely worth it.


Building the project with Grunt.

This one will probably have the greatest impact on the way you work on your projects. It’s a task runner. On the Grunt website, the reason to use it is stated as it “lets you automate just about anything with a minimum of effort”. What could that be useful for after we have our project laid out nicely and are ready to code? Lots! Let me explain.

The tasks that Grunt runs are defined sets of plug-ins which you can load with npm, configure in your Gruntfile.js, and then execute in order with the task-name you give them.

For example, Yeoman generators provide grunt serve to run while you’re coding. It starts a local webserver, opens a browser window and reloads the page whenever there are changes in the code base. This basically lets you see what you are programming in real time.

Running grunt will build your optimized project into a /dist subdirectory. “Optimized” can mean many things in this case. Here are some more example plug-ins you can add to the basic grunt or any other Grunt task.

And many many more. You can optimize your images, create code documentation on the fly, compile handlebars templates and what not. Here’s a list of all plug-ins. It’s probably a good idea to check if they are still updated before you use them. Quality can roughly be judged by the number of downloads. You can also create your own Grunt plug-ins.

For the sake of completeness, I would like to mention that Grunt is not the only task runner out there. Especially Gulp seems equally popular. They each have their (slight?) pros and cons which shall be discussed in a different article.


JavaScript Frameworks.

You were actually looking for something completely different when starting to read this? Hoping to learn about essential JavaScript libraries to include in your projects? Sorry to disappoint. I feel that there is no toolset in this category that can be generally recommended.

Every project has its own highly individual requirements. How vital is SEO? Are there REST services involved? Is there a lot of animation or DOM manipulation? These are some of the questions you should ask yourself before deciding on the set of JavaScript libs you are going to use.

It is important to choose wisely what to incorporate instead of following trends.

A project that might help you to make a decision on what framework will work well to generally structure your code is TodoMVC.


Summary.

Phew. This was it. You made it to the end. I hope you got an impression of what is out there that can improve your coding workflow. Let’s look at it again in a more compressed format.

We used:

  • bash commands to get started using the command line.
  • Git to keep track of our code changes and work collaboratively.
  • Homebrew to manage software for OS X.
  • npm to manage software needed to scaffold, process, and optimize our code.
  • bower to pull JavaScript libraries into our project.
  • yo and its generators to scaffold out a fresh project.
  • Grunt for processing our code and viewing changes in real-time.

I am by far still no command line ninja but now you can probably understand why I say there isn’t a single day of writing code without me opening Terminal on my Mac anymore. It makes the web dev process way smoother and I can tell you it feels great to get this dark area on the map of my programming skills more and more under control.

What I introduced you to are the most valued and used commands and tools in my personal workflow. You’ve got a different setup, would like to add to this one, or know other ways and tricks for front enders to getting done faster? Great! Feel free to share in the comments below, I’d love to know about them!

[mc4wp_form]